
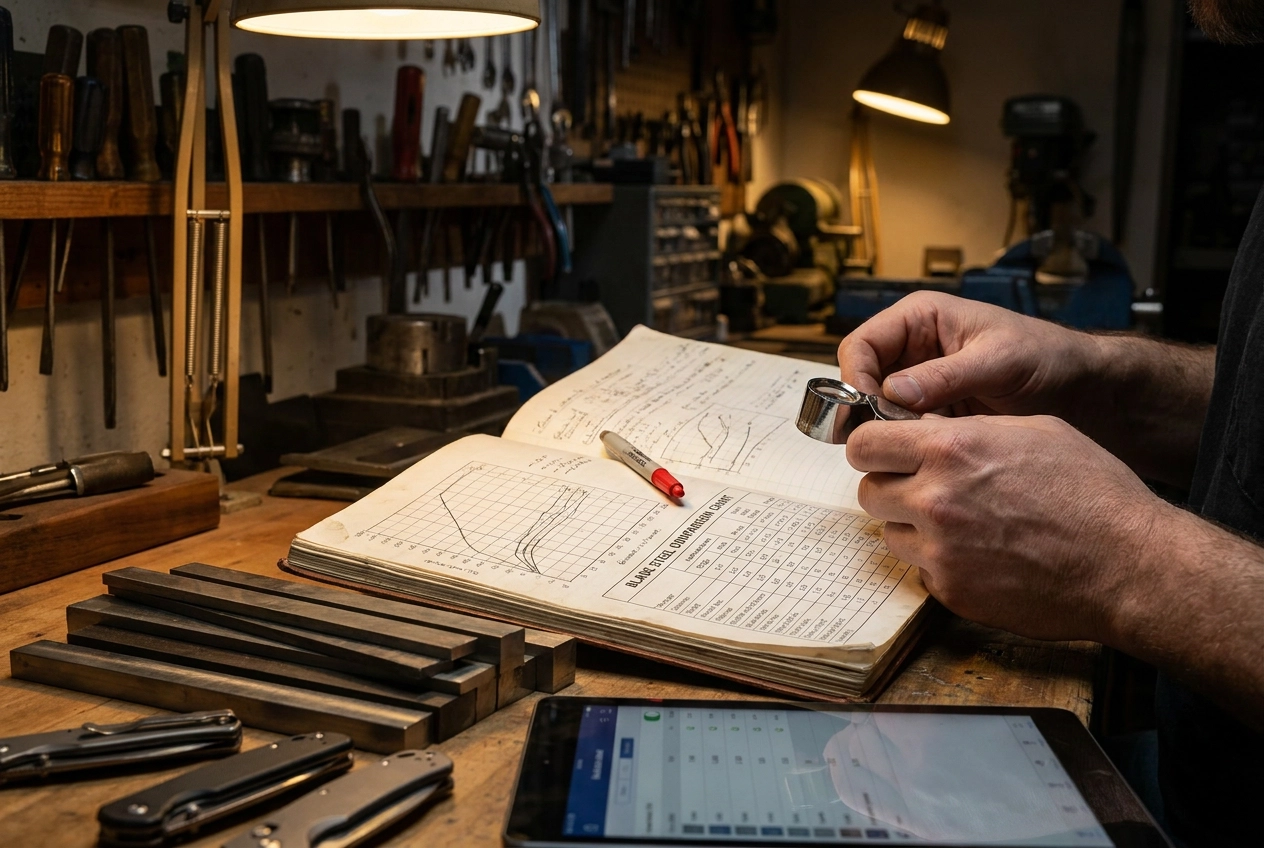
You have probably searched for the best knife steel chart at some point, found a colorful grid ranking dozens of steels from “budget” to “premium,” and walked away more confused than when you started. Those charts are everywhere, and most of them are doing you a disservice.
The problem is not that the data is always wrong. The problem is that nobody teaches you how to read it. Which axes actually matter for your specific knife? Why does the same steel perform differently depending on who heat-treated it? What are manufacturers quietly leaving out when they rank toughness, hardness, and corrosion resistance on a neat five-point scale?
This guide answers all of it. You will learn what the three core chart axes genuinely measure, why toughness and edge retention are locked in opposition by metallurgy itself, and how heat treatment can override everything composition suggests on paper. You will also get a practical framework for spotting credible data versus marketing copy, and a clear workflow for matching steel properties to the actual job your knife needs to do. By the end, you will read any steel chart with a critical eye, not just a hopeful one.
Why most steel comparison charts mislead you
Most blade steel charts have a foundational problem that has nothing to do with the steels themselves. They rank alloys by composition or carbon content, then present those rankings as performance data. They are not. A composition ranking tells you what elements went into the melt. It does not tell you how the finished blade will behave in use, because that is determined by heat treatment, and heat treatment is almost never disclosed.
The same steel at 62 HRC is a different practical tool than that same steel at 58 HRC. The harder version holds an edge longer but absorbs impact less gracefully. The softer version is tougher but dulls faster. Both are labeled with the same alloy name on every chart you find. Neither the toughness number nor the edge retention number means anything without the hardness target attached to it.
Manufacturer-supplied charts compound this. The axes are chosen after the fact, weighted to favor the steels that brand happens to sell. A company with a tough mid-carbon lineup will weight toughness heavily. A company selling hard stainless will emphasize corrosion resistance and edge retention. Neither is lying, exactly. Both are selecting the frame.
No regulatory body and no industry standard governs what a consumer-facing blade steel chart must disclose. The labels on “high carbon stainless” knives illustrate exactly this: the same phrase covers both genuine performers and budget steel with aspirational marketing. Two independent charts can rank the same steel in opposite positions and both be technically defensible, because they used different hardness targets, different test conditions, or different definitions of the axes.
The core problem is not bad data. It is undisclosed methodology. What a chart leaves out tells you as much as what it shows. That is where this guide starts.
The three chart axes and what they actually measure
Before you can spot what a chart hides, you need a precise definition of what its three axes are actually measuring. Most readers treat them as intuitive. They are not.
Edge retention is how long a blade sustains a usable cutting edge under abrasive work. The credible benchmark is CATRA testing (Cutlery and Allied Trades Research Association), which runs blades through a standardised cutting sequence and measures the edge’s performance against a defined threshold, conforming to BS EN ISO 8442-5:2004. The result is a number, not a descriptor. Charts that say “excellent” instead of citing CATRA data are giving you an opinion.
Toughness is not hardness. It is a steel’s resistance to fracture under impact. The standard methods are Charpy and Izod impact testing, which strike a notched sample and measure the energy absorbed before fracture, reported in joules per square centimeter. A high toughness number means the blade resists chipping or cracking under lateral stress. A hard steel that scores low here will micro-chip on bone, frozen food, or any task involving a sideways load.
Corrosion resistance is primarily a function of chromium content in solid solution. The stainless threshold is set by the minimum chromium content required to keep enough chromium in solid solution to protect the matrix, surface finish and carbide distribution also matter: chromium locked inside large carbides does not protect the surrounding steel matrix, which is part of why understanding core properties that matter in knives requires more than reading a composition label.
All three sit on a triangle. Push edge retention up by increasing hardness, and toughness drops. Raise corrosion resistance through chromium, and you may sacrifice wear resistance. No steel leads every axis at once.
That triangle is your first filter. A steel that scores high on all three axes without disclosed test methodology is a marketing claim, not a measurement. Treat it as a red flag and look for the numbers behind it.
Toughness vs. hardness: the trade-off that metallurgy locks in
That triangle of trade-offs from the previous section has a deeper mechanism behind it. Understanding it changes how you read every blade steel comparison chart you encounter.
That structural opposition, harder steel, less absorbed impact, is fixed by atomic-level mechanics: a harder steel resists deformation, which is exactly what you want for edge retention, but that same resistance to deformation means the steel has less capacity to absorb impact energy before it cracks. The atomic structure that holds an edge also propagates a fracture.
Carbon content drives this trade-off directly. More carbon raises hardness potential. It also reduces toughness. That is why a high-carbon steel like 1095, run at high hardness, will chip under lateral impact in scenarios where a lower-carbon stainless like 8Cr13MoV flexes and recovers. The 1095 blade holds a finer edge longer. It also breaks the edge faster when the load is wrong.
Alloying elements shift the position of this trade-off but do not cancel it. Vanadium, molybdenum, and tungsten allow a steel to perform better on both axes than its carbon content alone would predict. They do this by refining carbide structure and improving hardenability. The trade-off still exists; it just moves to a more favorable point on the spectrum.
Recent peer-reviewed research published in 2025 showed that simultaneous high toughness and high hardness is achievable, with impact values reaching 243 J/cm2 at 700 HV hardness through optimized heat treatment and grain size control. That is a meaningful result. It also required precise control of grain size, grain boundary structure, and carbide morphology at a level that most production knifemakers do not disclose and many do not apply consistently.
That context gives you a practical test for any blade steel chart. If a steel is marketed as both maximally tough and maximally hard with no caveats, ask what was measured and how. Knowing this trade-off is structurally fixed makes that question automatic. If no methodology is attached, the claim is marketing, not metallurgy. If you want to match a steel’s actual performance to a sharpening approach that suits it, the knife sharpener guide that matches the tool to your steel walks through that by steel type and hardness range.
Heat treatment: the variable that overrides composition
Knowing that the toughness-hardness trade-off is real and fixed by metallurgy is useful. Knowing that heat treatment controls exactly where on that spectrum your blade lands is more useful.
Identical alloy, different heat treat, the chart cannot tell them apart. The final HRC number, the hardness target after quench and temper, is the single most important undisclosed variable in most consumer-facing charts. Yet the majority of knife steel comparison charts omit it entirely. They list the steel name and rate it on a 1-to-10 scale with no note of what hardness the rating reflects. That omission makes the entire ranking ambiguous.
Tempering temperature is the lever. Higher tempering temperatures reduce hardness and raise toughness. Lower tempering temperatures do the opposite. Small shifts in tempering temperature produce disproportionate changes in hardness and toughness, the relationship is non-linear, which is why process details matter as much as alloy selection. Most production knifemakers disclose neither the tempering temperature nor the hardness target on their spec sheets.
Cryogenic treatment adds another undisclosed layer. Cryogenic treatment converts retained austenite to martensite and is an established process, its specific effect on edge retention varies by steel and is rarely documented by manufacturers. It is almost never mentioned on a manufacturer chart or a retail product page.
When you see a knife steel comparison chart with no HRC range, no tempering protocol, and no note on cryogenic treatment, you are reading a composition chart dressed as a performance chart. This applies whether you are comparing steels for a serious kitchen setup, where choosing a chef knife that actually holds its edge depends on understanding what hardness target the maker actually ran, or evaluating an EDC folder against field use demands.
Composition tells you what a steel can do at its best. Heat treatment tells you what the knife in your hand actually does.
Grain size and carbide morphology: what charts almost never show
Heat treatment determines where a steel performs. But two steels with near-identical composition and identical heat treatment can still land in different positions on a toughness chart. The reason is almost never printed anywhere a consumer can see it.
Prior austenite grain size is the variable. Research published in 2025 in Materials Science and Engineering: A identifies a critical threshold at 20 micrometers: grain sizes below that produce substantially higher impact toughness, while sizes above it cause significant drops. The same alloy, the same HRC target, different grain size from processing, and you get a different blade.
Carbide structure compounds this further. Coarse carbides, the kind that form during slow solidification in conventional ingot casting, act as stress concentrators at the edge. Under cutting load, they pull out or fracture, leaving micro-chips and an uneven wear pattern. Fine, uniformly distributed carbides support the edge matrix instead of undermining it. The result is a more consistent, longer-lasting cutting surface. Carbide morphology is why two steels with similar carbon content can feel completely different on the same cutting board.
PM steels such as S30V, S35VN, and M390 use powder metallurgy consolidation to produce finer, more uniform carbide distributions than conventionally cast steels of comparable composition, a structural advantage the alloy label alone does not convey. It is why PM steels frequently outperform what their alloy numbers would predict. Composition sets the raw potential; the PM process determines how much of that potential survives into the finished blade. The same principle applies to Damascus construction, where layer integrity and carbide continuity matter far more than the visible pattern. Our Damascus knife guide covers exactly how to evaluate that.
The 2025 data adds one more layer: grain boundary treatment alone pushed impact values above 100 J/cm2 at 700 HV hardness. That is exceptional performance at high hardness, achieved not through alloy additions but through processing. None of that appears on a retail spec sheet.
The practical read: when a blade steel comparison chart ranks two similar-composition steels differently on toughness, the gap is almost always grain size or carbide morphology, not the alloy itself.
Which axis to weight for your knife’s actual job
All of that metallurgy matters, but only in the context of what your knife actually does. Here is how to weight the axes by job.
Kitchen knives (chef, santoku, boning)
Prioritize edge retention and ease of sharpening. Kitchen cutting is repetitive, controlled, and board-based. There is no lateral prying, no batoning, no impact stress. A harder, less tough steel is perfectly acceptable here. Corrosion resistance still matters, but a consistent wipe-down after use handles most stainless-grade steels without issue.
EDC and pocket knives
Flip the order. Toughness and corrosion resistance come first; edge retention is secondary. A folder lives in your pocket alongside moisture, lint, and body heat. It handles varied tasks and occasionally takes stress it was not designed for. A chipped edge in the field is a worse outcome than an edge that dulled a little faster than your kitchen knife would.
Outdoor and survival blades
If the environment is wet, corrosion resistance leads. Saltwater, rain, and humid jungle conditions degrade an unprotected blade faster than any cutting task will. Toughness comes second, because batoning and chopping introduce impact loads that a brittle steel fails under. Edge retention comes third. A blade that rusts through or cracks is worse than one that needs more frequent sharpening.
Collector and hobbyist use
All three axes matter, but raw CATRA numbers often take a back seat to sharpening character. How a steel behaves on a whetstone, whether it takes a mirror polish, how feedback feels through progressive grits: these qualities drive collector preference in ways that a performance chart does not capture. Our ceramic knife FAQ illustrates how material properties translate differently depending on what a user values.
The habit that makes charts useful
Before you open any blade steel comparison, write down the primary job of your knife. Then read the chart for the one or two axes that job requires. Ignore every other ranking. A steel that leads on toughness but sits mid-pack on edge retention is not a weak steel. It may be exactly right for your use case, and a chart that does not tell you that is not serving you.
How knife steel types and families cluster on a chart
Once you know which axes to prioritize, the next step is recognizing where specific steels land on the chart. Steel families cluster in predictable zones, and knowing those zones lets you navigate any blade steel chart without relying on manufacturer color coding.
Carbon steels (1075, 1084, 1095, 52100) cluster toward the toughness and edge retention corner. High carbon content enables strong edge retention at elevated hardness, and the absence of significant alloying elements keeps the microstructure tough and predictable. The cost is corrosion resistance: these steels rust without consistent maintenance. They dominate outdoor and traditional working knives because toughness matters more than rust resistance in those applications, and an oiled blade stays protected.
Mid-range stainless steels (8Cr13MoV, AUS-8, 14C28N) sit near the center of the chart. They trade peak edge retention for meaningful corrosion resistance and serviceable toughness. None lead any single axis, which is exactly why they work: balanced, forgiving, easy to sharpen. They are the workhorses of production folders and kitchen knives under $50. For how steel composition shapes kitchen performance specifically, the Steel Snob guide to the best steel for kitchen knives walks through these tradeoffs by use case.
High-end stainless steels (VG-10, 154CM, CPM-154) push edge retention and corrosion resistance higher than mid-range grades without meaningful toughness loss, earning their place in premium kitchen knives and quality EDC blades.
Powder metallurgy super steels (S30V, S35VN, M390, 20CV, CPM-CruWear) occupy a zone conventional metallurgy cannot reach: high edge retention combined with solid toughness. The PM process locks fine carbides in place before large, brittle structures can form, so these steels hold a harder edge without the chip-prone behavior large carbide networks produce.
Tool steels (D2, O1, A2) offer high wear resistance but sit outside the stainless zone. D2 has high chromium content, but a substantial portion is tied up in large carbides rather than dissolved in the matrix, limiting corrosion protection relative to its composition label. Toughness varies sharply with heat treatment, so the same D2 blank behaves very differently depending on who ran the heat treat.
Six questions to ask before trusting any steel chart
Knowing whether a comparison chart is trustworthy is more useful than knowing how steel families cluster on it. Apply these six questions before acting on any blade steel chart’s rankings.
1. What HRC was used for testing? A chart without a disclosed hardness target measures composition, not performance. The same steel at 58 HRC and 62 HRC produces different toughness, different edge retention, and different practical behavior. Ask whether the ranking reflects a single target or a range, and whether that HRC represents a production norm or an optimized lab condition. If the chart cannot answer this, it is a composition guide with a ranking visual bolted on.
2. What methodology produced the numbers? CATRA testing (conforming to BS EN ISO 8442-5) is the credible standard for edge retention. Charpy or Izod impact testing is the credible standard for toughness. Descriptors like “excellent” or numbered 1-to-10 scales with no cited test standard are marketing communication, not measurements. Do not use them as a decision basis.
3. Who made the chart, and do they sell the steels ranked highest? Manufacturer, distributor, and brand-affiliated charts all carry potential bias. Axes can be weighted, HRC targets cherry-picked, and methodology omitted in ways that favor a particular lineup without technically lying. Source independence matters.
4. Does the chart disclose processing method and cryogenic treatment? Powder metallurgy versus conventional processing produces meaningfully different carbide distributions at identical alloy compositions. Cryogenic treatment converts retained austenite and can measurably raise edge retention in certain steels. Both variables shift performance significantly. Their omission explains many contradictions when comparing charts from different sources.
5. Is there any note on grain size or carbide morphology? A chart that ranks PM steels against conventional steels without flagging the processing difference is comparing unlike objects. If two steels with similar compositions land in very different toughness positions, the explanation is usually grain size or carbide structure. The chart should at least acknowledge that.
6. Does the chart connect rankings to use cases? A chart presenting a universal best-to-worst hierarchy tells you which steel is most demanding to produce, not which is best for your knife. A steel that ranks near the top for a Japanese knife focused on fine slicing may be a poor choice for a field blade that needs to absorb impact. Any chart that omits use-case context requires you to supply that layer yourself before the rankings mean anything.
How to tell credible steel data from marketing copy
Those six questions give you a filter. This section gives you the standard against which to measure what passes through it.
Credible sources name their method. A trustworthy steel data point identifies the test standard used (CATRA, Rockwell C, Charpy impact), states the hardness target at which the sample was tested, and specifies whether results came from controlled laboratory specimens or production blades. That last distinction matters: a lab specimen represents a steel’s optimized potential. A production blade represents what a manufacturer’s heat treat process actually delivers. Both numbers are useful. Conflating them is not.
Peer-reviewed research is the most reliable baseline. Academic metallurgical studies use controlled specimens with documented heat treatment protocols, which means you can isolate variables. When a published study tests a steel at a specific HRC and reports impact values alongside grain size data, you can read that result with confidence. It shows what the steel can do at its best, under known conditions. That is the ceiling against which production claims should be judged. These studies are accessible through academic databases and increasingly cited by independent reviewers serious about methodology.
Independent testing beats brand specifications. Manufacturer specs describe potential, not production reality. A brand sheet tells you what the alloy is capable of under ideal conditions. Independent testing with documented protocols and production-run samples tells you what the blade in the box actually does. The gap between those two numbers is where purchasing decisions go wrong.
1-to-10 scales with no cited standard are relative positioning tools, useful for orientation within one brand’s lineup, not for cross-brand decisions.
At Steel Snob, our steel guides anchor every characteristic to a use case, a hardness range, and an explicit trade-off. When we describe a steel’s edge retention, we note the context it was tested or used in. That framing is not a stylistic choice. It is the only way steel data translates into a decision you can actually trust.
Putting it together: a practical workflow for reading any blade steel chart
Now that you know how to separate credible data from marketing copy, the next step is applying that judgment in sequence. Here is a repeatable six-step workflow you can run against any blade steel chart you encounter.
Step 1: Identify the chart’s origin. Manufacturer, independent tester, or academic source. Manufacturer charts have a built-in incentive to flatter their own lineup. Independent charts vary by rigor. Academic sources are the most controlled but rarely cover production knives directly. Assign your skepticism before reading a single ranking.
Step 2: Check for disclosed HRC targets and testing methodology. Do this before reading any rankings, not after. No HRC target means the chart is describing composition, not performance. No cited test method (CATRA, Charpy, Rockwell C) means the numbers are editorial estimates. If both are missing, use the chart as a rough compositional reference only, not a decision tool.
Step 3: Filter to the axes your knife’s job actually requires. Write down the primary function first: edge retention for a kitchen knife, toughness for an EDC folder, corrosion resistance for a coastal outdoor blade. Then read only those columns. Ignore rankings on axes that do not apply. A kitchen knife that scores low on toughness is not a problem if it holds an edge through prep work.
Step 4: Cross-reference against at least one source that cites a standardized test method. Check whether the rankings agree. If two sources rank the same steel significantly differently, the likely cause is an undisclosed variable: different HRC target, different heat treatment protocol, different grain size from a different processing method. Divergence is information. It tells you the chart you started with omitted something important.
Step 5: Run the six questions from the previous section. A chart that cannot answer questions 1 and 2 is a starting-point reference, not a decision tool.
Step 6: Match your shortlist to the steel family section of this guide. Confirm that the typical properties of that family align with your use case. If the chart points you toward a high-carbide stainless but your priority is a tough outdoor blade, the family profile will flag the mismatch before you commit.
The straight answer on reading steel charts
Apply the six-question workflow and you have done most of the work. What remains is a clear-eyed read of what any blade steel comparison chart can and cannot tell you.
Charts document composition; performance requires knowing the HRC target and test method too. The three axes, edge retention, toughness, and corrosion resistance, are the right axes. They become useful only when each is backed by a disclosed test method at a disclosed hardness target, and only when you weight them against your knife’s actual job. A corrosion resistance score that would be irrelevant for a dry-climate EDC folder becomes the deciding factor for a saltwater fishing knife.
Heat treatment, grain size, and carbide morphology determine where a blade actually lands on those axes. Composition sets the ceiling. Processing determines the result. Those processing variables are almost never disclosed on consumer charts, which is why two charts can rank the same steel in opposite positions and both be defensible given different test conditions.
For applied examples, the Steel Snob steel guides cover common alloys by use case, with plain language on what you are trading when you choose one steel over another. That is where composition context, heat treatment reality, and your knife’s specific job come together in a usable way.
Conclusion
Steel comparison charts are tools, not answers. Used correctly, they narrow your options; used blindly, they send you chasing numbers that may not reflect real-world performance in your hand, on your task.
The core takeaways are straightforward. Composition sets a ceiling, but heat treatment determines where a blade actually lands. The three axes only carry weight when backed by disclosed test methods at a known hardness target. And no score matters until you filter it through your knife’s specific job.
Apply the six questions to every chart you encounter. Ask about hardness targets, testing methods, and source bias before you trust a ranking. That habit alone will separate useful data from marketing noise.
Pick up your next chart, run it through the filter, and let your use case make the final call. The right steel is the one that performs where you actually work.